At a solar PV plant, the historian is responsible for storing and logging the data that the SCADA system aggregates. It allows operators and stakeholders to look at historical data for the plant. There are many uses for this historical data that make running a solar PV plant more efficient, including troubleshooting, testing, reporting, analyzing performance...even predicting the future!
Let's explore how to maximize your SCADA historian investment.
1. What are the typical historian-related requirements for a solar PV plant?
There are two basic types of historians: local (onsite at the solar plant) and cloud-based. Cloud-based historians store the data offsite on Internet-based servers.
A local historian runs on its own server or PC, typically with a Windows operating system. It is connected to the SCADA network and has a data link to the HMI (human machine interface) software. The historian "looks" at the real time data from the HMI software and stores it on its local hard drive.
The two main considerations with local historian hardware are hard drive space and processing power. The hard drive space determines how much data can be stored and for how long, while the computer's processing power determines how many data points or tags the historian can handle.
A point or tag is a little packet of data that holds a value, such as a measurement reading, a triggered alarm, meteorological data, solar inverter data, or a tracker position. Each device, including meters, relays, solar inverters, MET stations, trackers, etc. at a solar PV site has data points that the SCADA system pulls data from and that the historian can log and store. The bigger the site, the more data points there are. While it is not necessary for the historian to store every single data point in the plant at every second (more on that in a bit), the historian processor and hard drive still have to take on a massive amount of data. It is important to have the right hardware so as not to overload the system.
The tag or point count also ties into the historian software. The more tags you have, the bigger the historian software package you will need. For example, there may be different levels of software licensing you would buy for a 50,000 tag site versus a 20,000 tag site.
2. What type of data should a historian store, and for how long?
The standard that we see for most utility-scale projects is five years' worth of stored data for a local historian, with data logged and historized every second.
As you can imagine, that's a huge amount of data! However, you don't need to historize every single data point from every single device at the plant. You can, but it's not advisable. It will overload the system unnecessarily with data points that you will never even see or use. The historian will be slower and more susceptible to failure, and will take far too long to process and pull up reports when you need them. You'll also be paying more for hardware to store and process all those data points, and more for the software licensing.
So, in order to maximize the efficiency of your historian, you need to be very careful about what you historize.
Here are some essentials:
- Alarms
- Key data measures from the meters, relays, Inverters and the controller, including:
- Real power
- Reactive power
- Frequency
- Voltage
- Production from each inverter
- PID controller output
Other important tags can include tracker position, irradiance, ambient temperature, and back of module temperatures. These all factor into the energy production of the panels, which is important information to track historically.
3. How does a local historian allow for greater efficiency over a cloud-based historian?
Cloud-based historians can be a good solution for some smaller sites. However, we recommend a local historian for any solar PV plant large enough to have a full local SCADA system (typically 20 megawatts or above). Some owners and O&M providers require both a local historian and a cloud-based third-party historian platform.
A local historian can store multiple years of data onsite, while a cloud-based platform can store data onsite for a week or two, but uses a cloud-based server for long-term storage. While a local historian can pull data every second, most cloud-based historians can only pull data every minute or every five minutes. Large sites with SCADA systems are complex and need the close monitoring, accessibility, and in-depth analytics and reporting that a full, local historian can provide.
There is also the extra reliability of having the historian right there onsite, physically plugged in and connected, with nothing going out of the system.
Any time you have a physical connection, you have more reliability. It is much harder for something to happen to your data through a direct wired connection than it is when the data goes wirelessly first through a Wi-Fi modem, then the internet server, and finally to the cloud-based server. There are simply more potential points of failure and interference.
4. What are custom historian database queries and how can they help maximize efficiency for Owners and O&M teams?
Historian data is raw data pulled in from the field devices, meters, and other site equipment. A database query means "asking" the historian to pull up data for a set of data points over a specified time period. Any historian can do this, though the query method can vary by software platform.
A standard database query brings up basic values—for example, the main measurements from the meters, or whether or not a certain alarm has been triggered. Custom database queries turn the raw historian data into calculated data that is useful for analysis, troubleshooting, and testing, such as trends and averages over time.
5. How do historian data trends and reports generation help improve system efficiency?
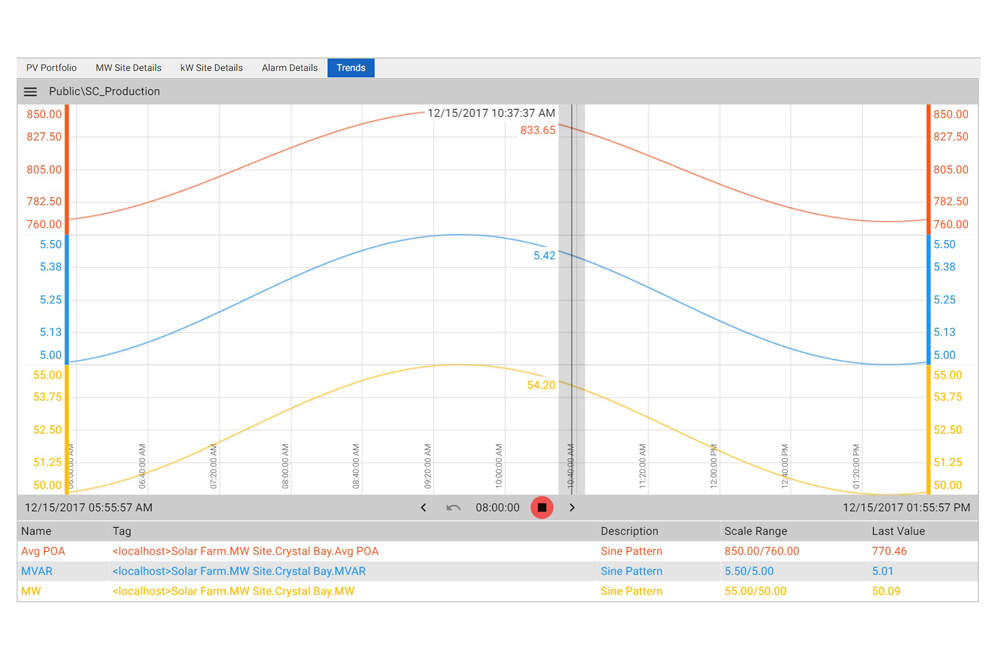
Data trends involve taking the calculated data from custom queries and putting it in a graph to visualize data points over a specific period of time. You can plot data points alongside each other to see how different plant variables affect performance. This makes it easier to analyze site performance, troubleshoot, spot areas for improvement, and predict the future efficiency of the plant.
Historian software platforms differ in their reporting features and analytics capabilities. We typically use the Canary Labs Historian, which has automatic reporting capabilities built in. You can generate trends and reports from raw data or processed data, and see what has happened at the plant over specified periods of time.
6. How does a historian help with SCADA system commissioning?
The historian doesn't just help with SCADA commissioning—it is essential. The historian is one of the first parts of the SCADA system that must be lined up and working properly, because it's used throughout the entire project for troubleshooting and testing.
One of the major parts of the commissioning process is controls testing. This involves plenty of tuning, tweaking, and adjusting setpoints in the power plant controller's logic. At Nor-Cal, we use the historian to keep track of the data over the tuning process, so we can see the effect our adjustments have.
This works for testing local controls, too, such as tracker controllers. We can use the historian to make sure the tracker angles actually changed in response to the setpoint command.
7. How does a historian help with plant operations?
Plant operators watch their HMI screens and see real-time data and alarms. If something goes wrong at the plant, they respond. That's important, but it's all focused on the present. To truly optimize plant operations, you need a solid understanding of what's normal and expected for the plant (which you gain from past data), and you need to be proactive about developing issues (predicting the future). The historian can help you do both.
For example, let's say there's an overshoot at your plant. The plant overshoots by half a megawatt but the controller is able to make production stable again in less than 10 seconds. Everything seems back to normal. But what caused it? Has it happened before, and if so were the conditions that led to it the same? Is it something to be worried about happening again in the future?
That's where you need the historian. You can go into the historian and plot the overshoot against irradiance and anything related to your logic, such as frequency droop. Maybe the frequency droop was triggered, so the setpoint was reduced because you need to adjust the frequency of the plant.
In this example, let's say you notice the irradiance dropped suddenly five minutes before the overshoot. There was a big cloud passing by. You use the historian to look at past irradiance drops and sure enough, they led to overshoots about five minutes later that the controller quickly course-corrected. By studying trends, you can identify what is normal and expected behavior for your plant and what is not.
To use a different scenario with our example, let's say that irradiance was steady, frequency droop wasn't triggered, and the wind and weather were fine. What else might have caused the overshoot? You dig into the historian and are able to determine that a 4 megawatt inverter was turned on right before the spike. You ask around and no one seems to know why, but the historian doesn't lie. You can then look into it further to determine who turned on the inverter and why, and if necessary, put protocols in place so the avoidable overshoot doesn't happen again.
8. How does a historian help make troubleshooting site issues more efficient?
Ninety percent of the troubleshooting in a solar plant is done with the historian's help.
If a device malfunctions suddenly, its historical data may offer visibility and insight into resolving the problem. Think of a murder mystery, where the detective arrives after the fact and has to examine the evidence to find out what happened. The historian is where all the evidence is. Using the historian, you can go back and "reconstruct" the malfunction and understand what happened, which makes it easier to find the best solution.
9. How can a historian help make ongoing plant maintenance more efficient?
The historian helps track problems that build up over periods of time. By monitoring changes in value for certain data points over days, weeks, and months, you can see if the correlating systems and devices are developing problems that need maintenance attention.
You can also use historian data to better time your planned maintenance activities. If you know that your plant production will naturally drop on a certain day in response to an upcoming weather event, you can schedule maintenance that day in order to minimize the production loss.
10. How does utilizing performance analytics software in conjunction with historian data improve efficiency of running and maintaining a solar PV site?
Earlier we discussed custom queries and how they turn raw data into calculated data that is useful for analysis. Performance analytics software pulls live data from the historian and does the calculations dynamically, turning raw data into deeper insights concerning site health and performance. The software makes it easier and more reliable to predict how much your plant should produce in different conditions.
You can read more about how performance analytics software turns historian data into actionable insights in our Solar Performance Analytics article.
Nor-Cal can help you make the most of your SCADA historian.
We draw from our many years of project experience to help owners determine how many years' worth of data they'll need to store locally along with the data logging capability, and recommend historian hardware and software that will meet those requirements.
If you have a solar PV project and want to discuss historian recommendations or any other aspect of the system, schedule a call with us today.