
Part 1
Advanced analytics, machine learning and AI are used across many industries to inform decisions, reduce costs and improve efficiency.
That technology now exists for solar!
Steve Hanawalt is one of the founders of Power Factors and a subject matter expert on solar performance analytics. Power Factors provides a real-time asset performance management software platform called Drive for the renewable power industry.
We asked Steve to share how utilizing solar performance analytics can reduce operational costs and improve energy productivity. This is part one of a two-part blog series from Steve.
First, what are energy analytics?
There are two categories of energy analytics: basic analytics and what the industry calls “advanced analytics.”
Basic analytics for the solar industry are the typical key performance indicators (KPIs) like availability, capacity factor, performance index and performance ratio. These standard analytics tell owners and operators things like, “Is the plant running efficiently?” and “Is the plant producing the energy we forecasted it would produce?” These basics are important but only go so far.
For example, let’s look at performance index. This basic KPI is the ratio of actual to expected production for a facility. A performance index of 100% or greater means the facility is generating as much production as expected. So what happens if that performance index drops below 100% for a period? Most monitoring tools will say, “You know what? You’re not making as much production of revenue as expected for this period.” Very few give any insight into why the drop in production occurred.
That’s where advanced analytics comes in. Advanced analytics allows owners and operators to drill down to the root causes of underperformance issues. Advanced analytics software uses machine learning, AI and sophisticated algorithms to pinpoint the source of underperformance. This allows for a more detailed loss characterization analysis.
Loss Characterization Analysis
A loss characterization analysis breaks down the underlying reasons for underproduction. The Power Factors Drive platform presents this information using a Pareto—or waterfall—chart, so users can quickly visualize loss categories and amounts.
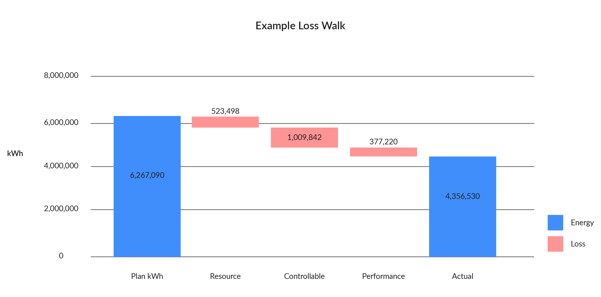
For example, say you were supposed to make a million kilowatt hours (kWh) last month, but you only made 700,000. What caused the 300,000 kWh of underproduction? You know you had less sunlight than usual—nothing you can do about that. But before you can attribute the whole drop in production to the whims of Mother Nature, you see that the “Resource” category (which covers the amount of sunlight received) only accounts for 50,000 kWh of poor production. What about the other 250,000?
You see from the chart that “unavailability” accounts for 100,000 kWh, meaning equipment was offline. The last 150,000 kWh come from the “underperformance” or “energy loss” category. Once you know these details, you can dig deeper into specific reasons for the energy losses, including equipment performance anomalies. For example, you might see that an inverter is operating in a temperature-derate mode, two combiner boxes are offline, and you have several trackers that aren’t working.
With these insights, you can take specific actions to recover those 150,000 kWh of lost or underperforming production, taking concrete actions like dispatching techs to the field for repairs or replacing or recalibrating underperforming assets.
How does asset management/performance analytics software complement a local SCADA system solution? Why do you need both?
The easiest way to understand this is to think about layers. The bottom layer is the power plant with all of its equipment and sensor data.
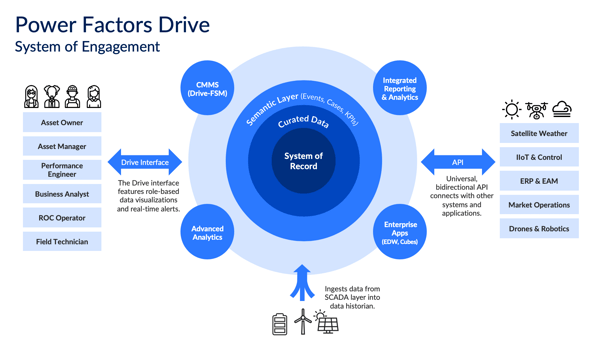
On top of that is the SCADA or Supervisory Control and Data Acquisition System. Its purpose in life is to acquire data and provide supervisory control of the plant—which it does very well. However, the SCADA doesn’t have the ability to understand the commercial environment the plant lives in, the regulatory and market environment, the operational cost structure of that environment, the different revenue and time of day rates paid by the utility, how many parts are in the inventory and so on.
That’s where you need the third layer—the asset performance management software layer. It lays on top of the SCADA to provide market, commercial, and operational and maintenance contextual intelligence. It complements the SCADA by pulling its data up into a business intelligence overlay, going beyond just the plant environment and into the business environment. It applies context to that data.
With that context, asset owners can see their solar PV plant not just as a bunch of ones and zeros and pieces of hardware, but as they relate to business objectives.
How does performance analytics software use SCADA historian data?
Data historians are necessary and important, but a data historian alone is non-intelligent. It's all raw data—not information. Performance analytics software like Power Factors Drive moves that raw data up the DIKW pyramid to knowledge and insights.
Drive sifts through the massive amount of digitized historian data to find the proverbial “needles in the haystack” that have value. When it does, it creates what’s called an event from that data, and sends out a role-based event notification. For performance issues, a performance analyst or engineer gets a notification. For a revenue variance, an asset manager gets the alert. The appropriate party can then take action based on those insights.
How does data curation/validation make automated notifications more effective and relevant?
Automated event notifications aren’t new. They’ve been around for years. These automated notifications are generated by what’s called an event engine, which is simply a rule-based tool that throws off a notification when a trigger threshold is reached. An event should only be something that needs attention.
The problem is that many software solutions don’t have data curation as a pre-process to their event engine. Without data curation—cleansing and validating the data beforehand—an event engine throws off a bunch of what statisticians call false positives. Operators call them nuisance alarms. Many owners and operators get frustrated with their systems because they generate so many of these bogus alarms.
A data curation or validation engine, like the one in Drive, is the answer. It uses powerful and sophisticated rules to qualify the alert that’s coming from the SCADA to make sure it’s valid.
Let’s look at an example. One of our Power Factors customers processes 55,000 events per week. Out of those 55,000 events, roughly 40% were duplicate or nuisance alarms. Using Drive reduced their nuisance alarms or false events to almost zero. Now, notifications are for true, actual problems, greatly improving their productivity and labor costs.
What is exception-based event management and why is it important?
Asset owners, operators and managers don’t have time to process all the data generated by their facilities. They’re overloaded with data. They don’t need to know about the things going right at their plant—they need to alerted about the things going wrong. That’s called exception-based operations, and it helps owners and operators focus on what they need to do in terms of their operational responsibility.
That's really what Drive’s event engine does. It operates like this: "Assume if everything's fine, we're not going to bother you. But if there's something that you should be worrying about, that's called an event, and we will tell you about that." That's exception-based management, and that's what the connection of data and events is all about.
LEARN MORE ABOUT solar performance analytics
This is the end of Part 1 of our article series on solar performance analytics. Learn more in Part 2, covering automation, workflows, and the benefits of a performance management platform for asset owners, operators, and O&M providers, and EPCs.